Will Alappuzha ever get an FM radio station?

Alappuzha, a 2 million-people city in Kerala, has a problem. It lacks its own FM radio station. Why’s that a problem? Because this isn’t some small town in the middle of nowhere. It’s a city with a population that demands an FM channel and has more than enough potential to deserve one. Before I talk about why Alappuzha might not get an FM station, here’s some history that will make clear why it matters.

Alappuzha_Medical_College

Alappuzha Medical College

There’s always been a lot of demand for an FM channel from the locals. All they have right now is relayed radio from New Delhi and Trivandrum, which they don’t want for obvious reasons. They want their own unique voice – their own FM station. Apart from that, there’s a community called the Kuttanad farmers who are keen on receiving a frequency that will detail conversations with agricultural experts, talk about new projects, subsidies and even allow farmers to air their own content – all of which will undoubtedly help them.

a farmer in paddy field

Farmer in a paddy field

nehr

Boat Race in Alappuzha


So if there’s demand, why haven’t the people and the State government of Kerala appealed to the Center in the past? Thing is, they have. The State government tried to do just that in 2006, 2009 and 2010; all three proposals were rejected. The Center said that they’ve already allocated all available frequencies to private companies who aren’t using those frequencies to broadcast anything. Basically, no slots and no FM. So far, save for the one relaying station AIR set up all the way back in 1971, the FM scene in the city has been dry.

Still, maybe it’s all in the past and Alappuzha will finally get an FM station in the upcoming round of auctions. After all, Phase 3 is supposed to spread the reach of radio to Category C and D small towns. But will they really get an FM station? My model predicts that the frequency for Alappuzha has only a 17% chance of getting auctioned. It seems a little pricey at a minimum price of 4.23 crores, given that cities like Guwahati, Agra, Surat and Allahabad sold for less.

If it’s any consolation, frequencies for Eroda, Salem, Vellore, Malegaon and Latur are also likely to go unsold. Citizens of Alappuzha: I’m sorry but your wait for an FM station just got longer.

Every frequency has a price at which companies will snap it up. This one is just a bit too high.

Predictions for FM Auction Phase 3

FM auctions for over 200 cities are starting tomorrow. Since 45 of 135 auctions failed the last time round, I tried to take a crack at finding which auctions will fail this time. This blog post is about my predictions for the second round of Phase 3 of this auction. Let’s see what happens when the actual auction data rolls in.

The cities least likely to get auctioned according to my model: Alappuzha, Eroda, Salem, Vellore, Malegaon, Latur, Bijapur, Bellary, Barddhaman, Baharampur, English Bazar, Abohar, Thanjavur, Dindigul, Kanhagad, Karaikkudi, Karur, Neyveli, Pudukkottai, Rajapalayam, Tiruvannamalai, Bharuch, Junagadh, Mehsana and Yavatmal. These cities have a lower ‘ratio’ because the model deems the reserve prices of these cities to be too exorbitant.

The cities most likely to get auctioned according to my model: Saharanpur, Muzaffarnagar, Ujjain, Ambala, Tinsukia, Nellore, Dhanbad, Siwan and Ludhiana. These cities have a higher ‘ratio’ because their reserve price is quite reasonable compared to the prices they’re expected to sell at.

I have built this model based on the ‘Category’, Domino’s pizza outlets, Cafe Coffee Day stores and Hero MotoCorp dealerships in each of these cities – a proxy for the paying capacity of consumers in that city.

The recommended bid is the value (in lakhs of rupees) that a company should want to start bidding at, and Max Bid is where the company should stop bidding. The last column indicates the chance of success of the auction.

Take Abohar for example. The reserve price is a good way away from the Maximum bid for its frequency – an indicator that the auction will likely succeed. Now, do the same for Alappuzha. The Reserve price is at the heels of the Maximum bid price. This is an indicator that the auction will likely fail.

These are my predictions for the second round of the Phase 3 FM auctions:

City Reco Bid (in lakhs) Max Bid (in lakhs) Reserve Price (in lakhs) Probability of auction success
Abohar 12 677 135 0.81
Achalpur 50 835 124 0.91
Adilabad 21 748 110 0.88
Adoni 50 835 110 0.92
Alappuzha (Alleppey) 141 480 423 0.17
Alipurduar 50 835 110 0.92
Alwal 50 835 110 0.92
Alwar 125 792 214 0.87
Ambala 292 992 123 1.24
Amravati 292 577 310 0.94
Anantpur 192 921 110 1.11
Arrah 12 677 39 0.96
Azamgarh 192 921 58 1.18
Baharampur 21 748 214 0.74
Bahraich 21 748 58 0.95
Baleshwar 21 748 58 0.95
Ballia 21 748 58 0.95
Balurghat 21 748 110 0.88
Bands 21 748 58 0.95
Bangaon 50 835 110 0.92
Bankura 21 748 110 0.88
Barddhaman 12 677 214 0.70
Baripada 21 748 58 0.95
Barshi 21 748 124 0.86
Basti 21 748 58 0.95
Beawar 21 748 110 0.88
Begusarai 12 677 39 0.96
Belgaum 279 565 268 1.04
Bellary 154 452 268 0.62
Bettiah 21 748 39 0.98
Bhadurgarh 12 677 123 0.83
Bhagalpur 154 452 105 1.16
Bharatpur 192 921 110 1.11
Bharuch 12 677 124 0.83
Bhatinda 234 926 135 1.14
Bhavnagar 268 553 310 0.85
Bheemavaram 21 748 110 0.88
Bhilwara 125 792 214 0.87
Bhiwani 12 677 123 0.83
Bidar 21 748 99 0.89
Bihar Shareef 21 748 39 0.98
Bijapur 12 677 268 0.61
Bokaro Steel City 12 677 39 0.96
Botad 39 760 124 0.88
Brahmapur 125 792 130 0.99
Budaun 21 748 58 0.95
Burhanapur 21 748 66 0.94
Chapra 21 748 39 0.98
Chhattarpur 21 748 66 0.94
Chhindwara 12 677 66 0.92
Chikmagalur 24 727 99 0.89
Chirala 21 748 110 0.88
Chitradurga 21 748 99 0.89
Chittoor 41 745 110 0.90
Churu 21 748 110 0.88
Coonoor 39 760 150 0.85
Cuddapah 12 677 110 0.85
Daman 21 684 124 0.84
Damoh 21 748 66 0.94
Darbhanga 12 677 39 0.96
Darjiling 41 702 110 0.90
Dehradun 446 741 448 0.99
Deoghar 21 748 39 0.98
Deoria 21 748 58 0.95
Devengeri 268 553 268 1.00
Dhanbad 690 1181 580 1.22
Dharamavaram 50 835 110 0.92
Dibrugarh 44 731 25 1.03
Dimapur 21 748 25 1.00
Dingdigul 21 748 150 0.82
Dohad 21 748 124 0.86
Durg-Bhillainagar 12 677 42 0.95
Eluru 21 748 110 0.88
English Bazar (Maldah) 21 748 214 0.74
Erode 268 553 423 0.46
Etah 21 748 58 0.95
Etawah 21 748 58 0.95
Faizabad/Ayodhya 21 748 58 0.95
Farrukhabad cum Fatehgarh 21 748 58 0.95
Fatehpur 21 748 58 0.95
Gadag Betigeri 50 835 99 0.94
Ganganagar 12 677 110 0.85
Gaya 154 452 105 1.16
Ghazipur 21 748 58 0.95
Giridih 21 748 39 0.98
Godhra 21 748 124 0.86
Gonda 21 748 58 0.95
Gondiya 21 748 124 0.86
Guna 21 748 66 0.94
Guntakal 50 835 110 0.92
Haldwani-cum Kathgodam 44 731 150 0.85
Hanumangarh 50 835 110 0.92
Hardoi 192 921 58 1.18
Hardwar 79 766 150 0.90
Hassan 21 748 99 0.89
Hazaribag 12 677 39 0.96
Hindupur 50 835 110 0.92
Hoshiarpur 68 756 135 0.90
Hospet 21 748 99 0.89
Hubli-Dharwad 314 601 268 1.16
Imphal 21 748 67 0.94
Itarsi 50 835 66 0.98
Jagdalpur 21 748 42 0.97
Jamnagar 268 553 310 0.85
Jaunpur 192 921 58 1.18
Jetpur Navagadh 50 835 124 0.91
Jhunjhunun 21 748 110 0.88
Jind 21 748 123 0.86
Jorhat 12 677 25 0.98
Junagadh 12 677 124 0.83
Kaithai 12 677 123 0.83
Kakinada 268 553 214 1.19
Kanhangad (Kasargod) 21 748 150 0.82
Karaikkudi 21 748 150 0.82
Karimnagar 192 921 110 1.11
Karur 21 748 150 0.82
Kavarati 50 835 5 1.06
Khammam 21 748 110 0.88
Khandwa 12 677 66 0.92
Kharagpur 44 731 110 0.90
Khargone 21 748 66 0.94
Kohima 50 835 25 1.03
Kolar 59 763 99 0.94
Korba 125 792 42 1.12
Kothagudem 21 748 110 0.88
Krishnanagar 21 748 110 0.88
Kurnool 267 560 214 1.18
Lakhimpur 192 921 58 1.18
Lalitpur 21 748 58 0.95
Latur 12 677 310 0.55
Ludhiana 1091 1581 989 1.21
Machillpatnam 50 835 110 0.92
Madanapalle 50 835 110 0.92
Mahbubnagar 24 727 110 0.88
Mahesana 12 677 124 0.83
Mainpuri 21 748 58 0.95
Malegaon 141 480 310 0.50
Mancherial 21 748 110 0.88
Mandsaur 21 748 66 0.94
Mathura 175 867 58 1.17
Maunath Bhajan (Distt. Mau) 192 921 58 1.18
Mirzapur cum Vindhyachal 21 748 58 0.95
Moga 68 756 135 0.90
Moradabad 685 1235 576 1.20
Motihari 21 748 39 0.98
Munger 21 748 39 0.98
Murwara (Katni) 21 748 66 0.94
Muzaffarnagar 267 560 130 1.47
Nagaon (Nowgang) 21 748 25 1.00
Nagarcoil/Kanyakumari 192 921 150 1.06
Nalgonda 41 745 110 0.90
Nandyal 21 748 110 0.88
Neemuch 12 677 66 0.92
Nellore 279 565 214 1.23
Neyveli 21 748 150 0.82
Nizamabad 192 921 214 0.97
Ongole 21 748 110 0.88
Orai 21 748 58 0.95
Palakkad 125 792 150 0.96
Palanpur 21 748 124 0.86
Pali 21 748 110 0.88
Panipat 151 842 123 1.04
Patan 21 748 124 0.86
Pathankot 116 806 135 0.97
Porbandar 21 748 124 0.86
Portblair 21 748 25 1.00
Proddatur 21 748 110 0.88
Pudukkottai 21 748 150 0.82
Puri 44 731 58 0.98
Purnia 21 748 105 0.88
Puruliya 21 748 110 0.88
Rae Barelli 125 792 58 1.10
Raichur 21 748 99 0.89
Rajapalayam 21 748 150 0.82
Ramagundan 50 835 110 0.92
Raoganj 21 748 110 0.88
Ratlam 12 677 66 0.92
Rewa 12 677 66 0.92
Rewari 44 731 123 0.88
Rohtak 44 731 123 0.88
Sagar 154 452 140 1.05
Saharanpur 292 577 130 1.57
Saharsa 21 748 39 0.98
Salem 267 560 423 0.47
Sambalpur 12 677 58 0.93
Sasaram 21 748 39 0.98
Satna 12 677 66 0.92
Sawai Madhopur 21 748 110 0.88
Shahjahanpur 154 452 130 1.08
Shimoga 192 921 268 0.90
Shivpuri 21 748 66 0.94
Sikar 192 921 110 1.11
Silchar 12 677 25 0.98
Singrauli 50 835 66 0.98
Sirsa 12 677 123 0.83
Sitapur 192 921 58 1.18
Siwan 192 921 39 1.21
Sultanpur 192 921 58 1.18
Surendranagar Dudhrej 50 835 124 0.91
Thanesar 39 760 123 0.88
Thanjavar 24 727 150 0.82
Tinsukia 192 921 25 1.23
Tiruvannamlai 21 748 150 0.82
Tonk 21 748 110 0.88
Tumkur 199 893 99 1.14
Udupi 50 835 99 0.94
Ujjain 267 560 140 1.43
Vaniyambadi 50 835 150 0.87
Vellore 279 565 423 0.50
Veraval 21 748 124 0.86
Vidisha 21 748 66 0.94
Vizianagaram 12 677 110 0.85
Wardha 21 748 124 0.86
Yavatmal 12 677 124 0.83

A probability greater than 1 in the last column indicates a 100% chance of the frequency getting sold.

Some data about the reserve prices wasn’t available, so what follows is an FM prediction for certain cities in case they do go up for auction:

City Reco Bid (in lakhs) Max Bid (in lakhs)
Amritsar 1009 1503
Asansol 607 1109
Bhopal 1196 1689
Chennai 10842 12121
Coimbatore 1295 1802
Gangtok 41 702
Gulbarga 154 452
Gwalior 303 588
Indore 1359 1867
Jabalpur 760 1253
Jalandhar 705 996
Kannur 188 504
Kolkatta 9868 11389
Mangalor 539 827
Mysore 622 911
Pannaji 44 731
Pondicherry 410 699
Raipur 611 901
Rajamumdry 267 560
Rajgarh 50 835
Ranchi 637 956
Shimla 41 702
Siliguri 373 661
Tiruchy 279 565
Tirunelveli 154 452
Tirupati 154 452
Tiruvananthapuram 242 545
Trissur 448 745
Tuticorin 141 480
Vadodara 1253 1759
Vijayawada 784 1276
Visakhapatnam 760 1253
Wadhwan (Surendernagar) 21 748
Warangal 267 560

I’ll talk about how I built the models that went into this prediction, the data collection behind the variables I used, the conclusions I drew from this model and how this model scales up to the actual auction in the next few blog posts. I’ll also talk about how I constructed the ratio that judges whether a frequency is fairly priced or not. Stay tuned.

Predicting FM Auctions (Phase 3) – Part 1

The second batch of Phase 3 FM Auctions in India is to take place tomorrow. This means that radio spectrums for over 200 cities are going to be up for auction. Now, what’s a spectrum? And how can a radio company broadcast its content in that spectrum? A spectrum, the same as a frequency, is a slice of a city’s bandwidth. You can think of a frequency as a proportion of the city’s capacity to broadcast.

Buying one of these spectrums allows a radio company to air content in that city. For example, if a city has 7 frequencies up for auction and we go ahead and buy one, we earn the right to broadcast in that city along with 6 other companies – provided that every frequency sells.

Tomorrow, all these frequencies are going to be up for auction and bid on by big players in the Indian radio market such as Entertainment Network India and HT Media, who shell out crores of rupees for frequencies. And why would a company pay this much for rights to broadcast in a city? Because advertisers pay them huge money for those 30-second segments that feature in between songs on the radio.

My only real exposure to FM radio is having it play in the background of cab rides (my family and I prefer to talk), but the idea of being able to maybe predict something – to essentially ‘see’ the future, got me quite excited. That’s why I decided to try and predict the prices these frequencies would sell at before the auction happened. This is what I’ve been working on over the past few weeks. I found the results for the first batch of Phase 3 auctions here and built a linear regression model trained on this data. Then, I went on to use this model to predict the prices that these 200 plus frequencies would sell at.

radio-mirchi-hindiHT media

The next few blog posts are going to be about this process of model building, finding out how much these private companies should bid and whether certain frequencies are going to get sold at all or not. These new blog posts might also be about me hitting way off the mark and trying to learn why my predictions were wrong. I’ll find out soon enough. I’ll head back to recommender systems once I successfully build and test this model. And once I see how it compares to the actual prices these frequencies get sold at.

Building a model that predicts where Domino’s pizza should open

Picking up where I left off on my last blog post, I decided to work on Domino’s Pizza and see what I’d find. I got to work and applied user-based collaborative filtering to my franchise data of store locations for Domino’s Pizza, Eicher Motors, Hero MotoCorp, Cafe Coffee Day, Inox Movies and V-Mart from back in 2015. I found a package called recommenderlab in R and (I’ll spare you the technical details) built a model to recommend locations for franchise openings. I was prepared to run my program right away, but first I had to make sure this model could predict franchise locations at least somewhat accurately. I had to make sure my program worked.

To do this, I took store location data for Domino’s Pizza that I’d collected back in 2015 and ran my model. It told me that Bharatpur, Chittorgarh and Palakkad were the top 3 towns Domino’s should open in. I went onto the Domino’s locations web page to see if I’d struck gold. And I had. One year later, Domino’s now has stores open in Chittorgarh and Palakkad.

dominos logo

This really excites me because if this holds true for other franchises, then maybe I’ll know where franchises are going to open before they do. And maybe, to some degree,  I’ll be able to recommend cities for companies to open in.

Recommending future franchise locations

I grew up in Margao, Goa – a place known for beaches, greenery and a happy-go-lucky lifestyle. As kids, my friends and I loved junk food. Every summer we’d talk about how a friend of mine went to an aunt’s house in Mumbai or some other big city and how he’d eaten at Domino’s pizza or KFC while he was there. We’d always ask the same questions: “How was the food?” and “Is it better than pizzas here?”, and we’d always get the same answer: wide eyes and a hum of approval. More than that even, I think we liked the idea of being part of a big city. Being big time. Eating pizza at Domino’s was definitely worth bragging rights as a middle schooler in Goa.

Margao was a sleepy town. There were no Domino’s or McDonald’s or Inox movie halls. On some weekends, my friends and I would take an hour long bus to Panaji just to get to eat at Domino’s pizza and watch a movie at Inox. We would plan this trip for weeks and spend a lot of that time wishing that Domino’s would someday open in Margao. This got me thinking about ways by which I’d know when and where a new franchise would open. I needed to know when Domino’s was coming to town.

India_Goa-30

Bogmalo beach, Margao

Margao_small

A map of Margao

Now, 5 years later, I finally have the skills to try and do this. The next few blog posts are going to be a slight bit different; I’m going to be exploring the possibility of future franchises using recommender systems and R. I found a course offered by the University of Minnesota and this link quite helpful in understanding how recommender systems work. There’s plenty of recommender algorithms out there. I studied recommender systems and found that User-based collaborative filtering would best serve my purpose of, well, predicting the future.

User-based collaborative filtering basically means this: If you like pizza and I like pizza, we have similar tastes. If the both of us also like Thai food, we’re more similar. This means that if you like Chinese food, I’ll probably like it too. The more foods we like in common, the more likely it is that we have similar tastes. User-based collaborative filtering does exactly this: it predicts what I’ll like based on what similar users (you) have liked. This system is used by Amazon, Facebook, Twitter and many other heavyweights in the tech world.

Instead of using recommender systems for ratings and ‘you may also like’ products, I decided to use it to map companies and their store locations. To recommend to companies where they should open their next store. Stay tuned for what’s to come.


Does Uber charge more in bigger cities?

You’d pay about twice as much for an Uber ride in Nashik than in Ahmedabad. I’ve always written about franchises of companies that I see around – Inox, Cafe Coffee Day, Domino’s Pizza –and companies that intrigue me, like V Mart and Equitas Microfinance. Apart from two exceptions (Hero Motocorp and V Mart), the general ‘rule’ I’ve learnt is that more GDP equals more franchises. My friends in Pune say that Ubers are more expensive than auto rickshaws, but I’ve found that they’re priced about the same in Hyderabad. This got me curious and I decided to take a look at Uber pricing in different cities.

For a company like Uber which doesn’t have franchises, I looked around for a parallel to this ‘rule’. I couldn’t get my hands on the data of the number of cars they have per city, but I found what I think is a pretty close match: the amount they charge customers. Franchise or no franchise, as long as a service isn’t a luxury good, businesses should want to reduce prices for their poorer customers right? If they didn’t, people would just switch to booking other cabs. Or taking auto rickshaws.

Uber_Logobit_Digital_black

So why isn’t this ‘more GDP equals more franchises’ rule true all the time? Well, the argument I make in the blog posts linked is that V-Mart and Hero Motocorp specifically cater to poorer rural markets. Does Uber cater to rural markets? Nope, not yet at least. There’s not one small town in Uber’s 27-city empire.

Uber’s absence in towns makes total sense. For a town to interest Uber, the people of the town would need smartphones with an active data connection to book a cab (that’s changing a little now) and there would need to be enough employable youth who own cars.

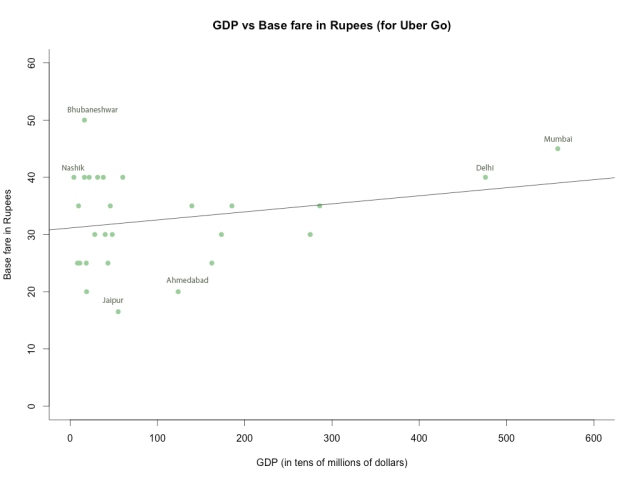
Here’s a graph I plotted that shows the lack of correlation of the base fare for Uber Go cabs on the GDP per capita in tens of millions of dollars. I found the price data on their website here. The correlation coefficient of this graph is 0.06; no correlation.

Base fare (0.06)

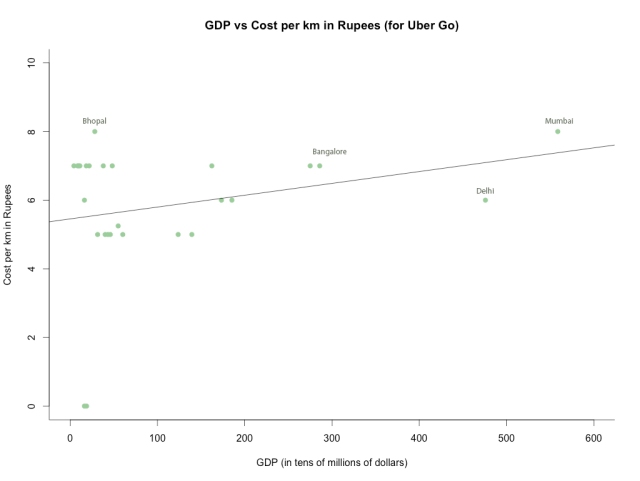
I thought that maybe base price isn’t a good parameter because some cities are larger than others, and smaller cities, on average, could charge higher base prices. That’s why I decided to take another parameter: cost per kilometer. This is the price you pay above the base price after a certain number of kilometers (generally 4 or so). I expected to find something that showed correlation – evidence that people in Nashik wouldn’t actually be paying twice as much as people in Ahmedabad – but I didn’t. I ran the correlation with cost in rupees per kilometer instead and got an R value of 0.06 again.

Cost per km in Rupees (0.06)

So Uber is a company that doesn’t seem to charge it’s richer customers more – something that’s pretty unusual. On average, maybe Uber still does charge customers from bigger cities more, but it’s not something that increases progressively with GDP. The only other times I’ve seen this pattern are with companies that cater to rural markets. I want to find out if this is exclusively an Uber thing, and to do that I’m going to need to take a look at Ola cabs, Uber’s closest competitor in India, and see what’s up. That’s what I plan to do next week.

Does Equitas Microfinance still work for the poor?

Microfinance has made a pretty major comeback after the whole 2010 fiasco where people bashed MFIs (microfinance institutions) for being ineffective at fighting poverty, money hungry, and, in the Indian state of Andhra Pradesh, responsible for farmer suicides. There was general public outcry at the idea of for-profit MFIs. Intuitively, it seemed to make sense that the only way to make a profit when dealing with the poor would be to pick the poor’s pockets. This really broke the Robin Hood perception that microfinance had built around itself. I learned all this from Challenges of Global Poverty – the same course I talked about in this blog post.

 
MfiFinal.jpg

Recently, I saw that there was not only a resurrection of sorts for microfinance as an industry, but for the for-profit MFIs as well. Bandhan, Equitas, SKS, Janalakshmi, and Ujjivan – the five biggest MFIs in India based on loan portfolio size (according to the 2014-15 SKS annual report), are either public or have an IPO waiting in the wings.

I wanted to see exactly how for-profit microfinance institutions were making a killing. Did they change where they were based? Apart from a withdrawal from Andhra Pradesh, the state where the government made repaying MFI loans illegal, causing many of these institutions to nearly shut shop, there weren’t many changes. Had they changed their target customers? I can’t say. It didn’t look that way from their reports. The stories about women transforming their hobby of stitching into a full blown saree business were all there.equitas.png

To answer this question, I’d have to see if for-profit MFIs were serving the poorest of the poor or whether they had moved on to slightly bigger fish. I decided to take a crack at it by comparing the GDP of a city against the number of Equitas Microfinance branches there were in that city. If they were looking to maximize profit, it’d seem like they would prefer larger, wealthier accounts (for a higher profit margin per account). And if they were moving to cities with a higher GDP, that could mean they were ‘abandoning’ the poor in pursuit of this bigger fish in bigger cities.

I found the branch data for Equitas on their website.

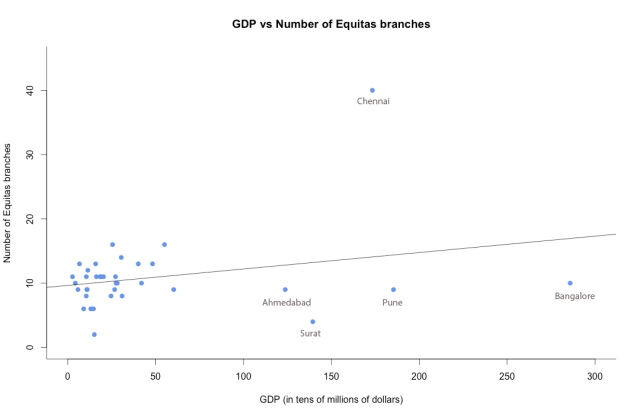
GDP vs Number of Equitas branches

A quick fact about the graph: Chennai is such an anomaly because Equitas is based in Chennai.

I found a correlation coefficient of 0.73 when I regressed the number of Equitas branches on the GDP for each town. This is a pretty convincing correlation. So, yes, Equitas at least, was moving to cities. Still, does that mean it’s fair to start pointing fingers at MFIs and accuse them of ‘abandoning’ the poor? No, it’s likely that there could be a ton of other factors I overlooked.

First, moving to a city doesn’t make an MFI less sensitive to the poor. It could just mean that they cater to the urban poor – something that I haven’t taken into account. Second, this is specific to Equitas. Not all MFIs are distributed like this. Third, maybe a third factor, such a population, would explain both these variables.

To narrow my search, I’d have to test the branch location data of MFIs against the percentage of poor in each city, other MFI locations (to see if they open in the same cities) and population. This would make a little clearer if Equitas and other MFIs still operate for the poorest of the poor. I’ll do this in upcoming blog posts and hopefully come closer to an answer.

Do women-headed households spend more on jewellery?


It’s now a couple months that I’ve been studying what could possibly influence store locations of many big franchises. Cafe Coffee Day, Domino’s pizza, Inox, PVR, Eicher Motors – there’s been a few now. In nearly every one of those cases, the answer seemed to be GDP. GDP was almost always the best indicator for store location, and for good reason. It makes intuitive sense that a location with more production has more income and that a location with more income has more spending.

Still, I wanted to see if there was somehow a better indicator – one that was not as obvious. So I switched tracks from a mid-range franchise pool (Domino’s pizza, Inox) to a premium pool to see if I’d find something new. I decided to take up Tanishq, both because it’s India’s leading jewellery brand with 160 stores and because they’ve racked up a reputation for superior design.


Tanishq

I figured that the proportion of number of households headed by women to the total population would be a good variable to compare against Tanishq stores. It seemed to make sense that a woman who called the shots in the family would have more room to spend on things she wanted, the same way a man in a typical patriarchal family would spend more on things he wanted.


%womenheaded-Tanishq

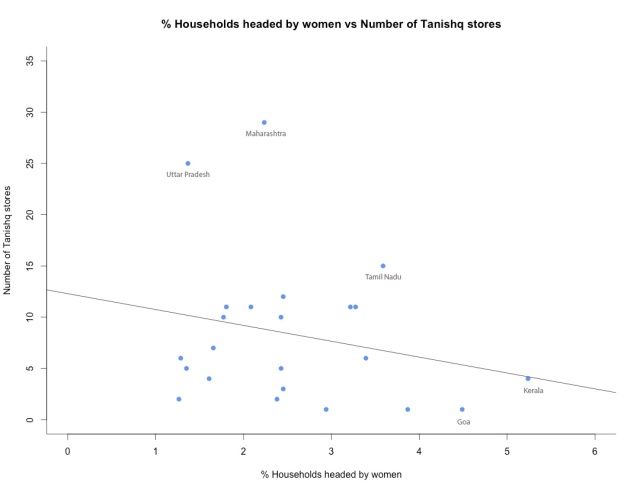
% Households headed by women is the number of houses where a woman brings the majority of family income to the household (per state), divided by the state population. This data is from the 2011 India Census. I found the data on number of Tanishq stores on their website.

I regressed the households headed by women on the number of Tanishq stores per state and found a correlation of 0.52. This wasn’t small, but it wasn’t large either. I took the variables by state because taking them by district left me with a whole lot of single-store districts and no meaningful conclusions.

A lot of things could be going on here: Maybe, as Poor Economics – a book which proved to me that something as easy-looking as financial aid doesn’t really help the poor – suggests, women are better at allocating earnings to the family, and not themselves. Maybe in households that purchased from Tanishq, jewellery was a gift and not something the wife went out and bought.

Another likely reason could be that Tanishq is following a specific expansion plan – they have a higher presence in North India. This would interfere with our assumption that Tanishq store locations per state are purely a function of the number of women-headed households in that state.

Or maybe, and I think this is the more likely picture, a third factor explains the two. For example, GDP. Maybe households are more likely to be headed by women in more developed states, and Tanishq prefers opening in these developed states.

Next week, I’ll try finding a better variable to explain Tanishq store locations – one that will hopefully show a stronger correlation than GDP.


Coursera vs edX

It’s been a while since I last posted. I was preoccupied with finals and keeping up with my courses – both on Coursera and on edX. As of today, I’m almost done with 8 courses on Coursera. On edX however, I started my first course about four weeks ago (14.73x The Challenges of Global Poverty offered by MIT – it’s a great course). I’m still a bit of an edX rookie. Still, in this off topic post I hope to highlight the differences that I’ve experienced in course-taking on both platforms.coursera-logo-cropped1

Coursera and edX are both huge. Coursera offers over 1800 and edX offers about 900 courses from over a hundred ‘global partners’ – schools and universities from around the world.


edX_logo


TL;DR version
Screen Shot 2016-03-17 at 8.48.46 PM

Both these platforms are incredible for learning, but if you’re looking to learn without a hefty time commitment, go for Coursera. If you’re looking to develop a lot of depth, go for edX.


Lectures

Taking a course on Coursera is a lot like watching a YouTube tutorial series; the lectures are generally short videos tailored to the exact syllabus of the course. These videos are filmed with only the professor in frame and do not deviate from topic.

edX is not quite the same in this respect. The videos are taken inside an actual college classroom. These videos occasionally feature student discussions that provide context but are sometimes redundant.

Effort

The effort, measured in hours of commitment per week is course specific and mostly independent of platform. Most Coursera courses allow you to take a quiz a number of times before there’s a grading deadline. Some of the courses with a lighter workload can even be done casually.

edX is not that generous. A bad homework score can really hurt your grade. The exercises and quizzes tend to be more rigorous. This means that edX courses need more time to work through.

Flexibility

Most Coursera courses I have taken allow you to apply for ‘late days’ – extra days where you can scramble to complete your assignment after the deadline. At the very least, Coursera content is released beforehand. This means that I don’t have to wait for the end of Week 1 to start watching Week 2 lectures.

edX is a lot stricter. There’s no late days. If you miss a deadline, you miss it. Another thing is that lecture content is not released until the end of the week. This means that on edX, you can’t start your work ahead of time. This can hurt your final grade if something unexpected comes up.

Reading Assignments

Most of the Coursera courses I worked through only had a course textbook which was not necessary to complete the course with a perfect grade. There were no reading assignments, and the weekly quizzes only tested the material that was taught in the videos.

edX has reading assignments every week, along with a course textbook that you really need to understand the lectures. This is because the professor could – and often does, refer to material from the reading assignments.

Grading

Grading, like effort is course specific. There might be a final exam, a final project, homework submissions, tests and/or writing assignments. ‘Introduction to Guitar’, a course offered by Berklee College of Music on Coursera required me to upload audio of my guitar playing to SoundCloud – which was then graded by other students taking the course with me.

One difference though, is that edX has some writing assignments that are self-graded rather than peer graded. The idea is that you critique your own work based on the guidelines they provide you with.

If the college offering the course is something that matters to you, be sure to check out which platform offers what you’re looking for. This is because a college or university generally offers courses on only one of the two platforms (MIT and Harvard offer only on edX; Stanford offers only on Coursera).


Coursera and edX are both great platforms to learn new skills and learn about new things. Still, if you don’t have too much time to spend on the course, Coursera is probably a better option. If you want something closer to real college – with reading assignments and inflexible deadlines, edX is probably a better option.

Note that I’ve compared the free courses offered on both platforms. A Verified Certificate, which is a paid course on Coursera is typically more rigorous. I have not done any Verified edX courses yet, but when I do I’ll update this page.

Does Hero MotoCorp prefer opening in towns with … lower two wheeler count?

When I last looked at Hero’s data, I plotted the store count of each town against the GDP of that town and found a correlation coefficient of only 0.52.  Here’s that post if you want to check it out. An R value of 0.52 is a moderate correlation, but not a conclusive one. So, I went ahead and tried looking for other variables – ones that might do a better job of explaining Hero MotoCorp showroom locations.

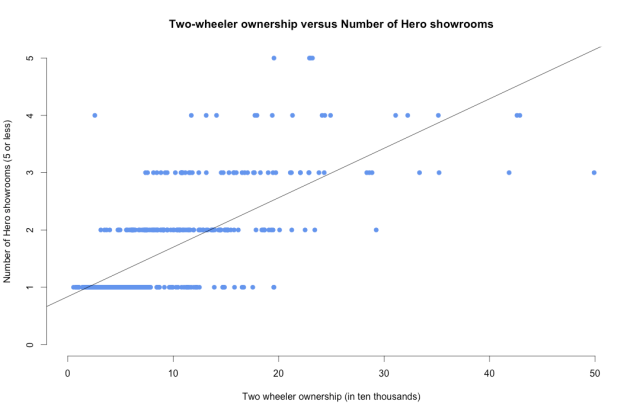
I found How India Lives – a pretty cool database with a couple thousand variables that would probably prove useful in my search for a stronger variable. I decided to plot the Two wheeler ownership – or the number of two wheelers in each district against the number of Hero showrooms in that district. I combed through my own Hero data and the How India Lives two wheeler ownership data to make this spreadsheet.

I expected a really high correlation coefficient of about 0.90. I mean, if the number of two wheelers in a district was not going to correlate with the number of Hero showrooms in that district, what would? I made a plot for the spreadsheet and found that I was dead wrong.

MARKERS-Ownership vs. Hero updated full


The correlation coefficient for two wheeler ownership against the number of Hero showrooms came to 0.53. Barely any better than the moderate correlation I found against GDP. Worse still, the plot really does not make much sense for when there’s 5 or less than 5 Hero showrooms. Here’s how it looks:

5 down


Maybe, I thought, Hero was not a big player in the motorcycle industry. I looked through their 2014-2015 annual report and found that they are the world’s largest manufacturers of two wheelers, and boast a 40.1% market share in the domestic two wheeler market. Hero was definitely a big player.

So, why does the district wise two wheeler ownership not agree with the showroom count? I don’t know yet, but I’ll keep this page updated to try and find out why.