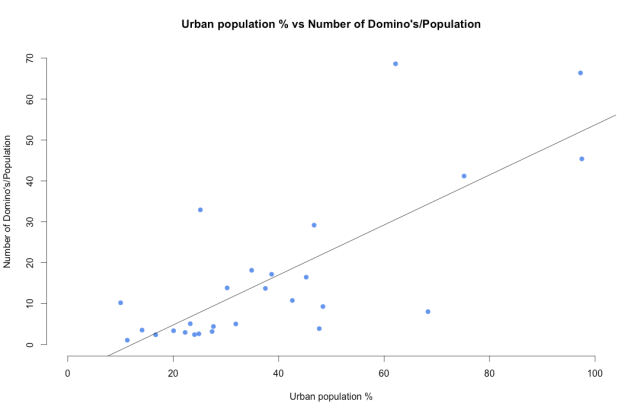
Domino’s and GDP

dominos logoI left the last post talking about what could possibly determine the location of Domino’s restaurants. The correlation between the Urban population percentage of a city and the number of Domino’s stores in that city proved to be meaningful but not conclusive.

So picking up where I left off last week, I correlated the GDP of a city with the number of Domino’s restaurants in that city to try and find a more compelling reason for Domino’s to open an outlet in a new town.

Number of Domino's stores vs Relative GDP

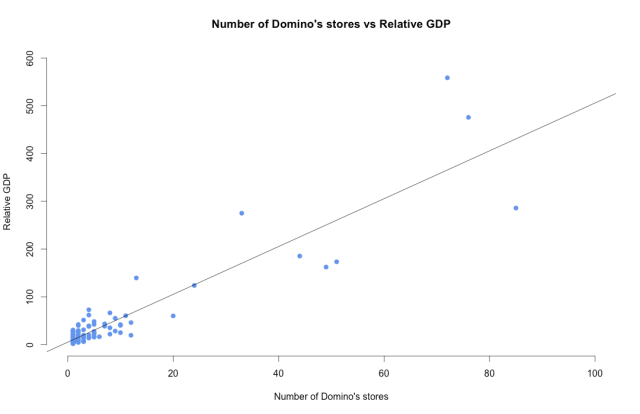
This graph plots the number of Domino’s stores in a city against the “Relative” GDP of the city. The data is sourced from here. Relative GDP of a city here refers to the GDP of a city divided by 10^8 to make the numbers scaleable.

The R value for this plot is 0.83, which is a very strong correlation coefficient. This means that 83% of the location of Domino’s stores is explained by Relative GDP of the city. This is very significant because an R value of 0.83 offers me enough insight to try and make a calculated estimation of where a Domino’s store could possibly open.

So will a Domino’s open near your place? A good part depends on the GDP of the city you live in.

Why should a Domino’s restaurant open near my place?

I’ve spent most of my life in the larger cities of India and to me, it seemed obvious that these cities would have a lot more outlets of a franchise, say Domino’s restaurants. A higher urban population should mean more people eating pizza right? I wanted to find out if what I thought – a higher urban population equals more Domino’s restaurants, was right.

dominos logo

Urban p

This graph plots the urban population percentage of a state against the number of Domino’s restaurants per person for that state (multiplied by 10^7 to make the numbers scaleable). Here’s the source data for this plot. I have not included the numbers from Telangana and Andhra Pradesh in this plot because I could not find reliable data on the urban population percentage for these states.

There is a general upward trend in this plot which I thought was normal, but when I went ahead and calculated the R value for this regression plot, it was pretty surprising.

The R value was 0.57, which is a decent correlation coefficient, but not remarkable or conclusive at all. I had expected urban population to explain about 75% of Domino’s restaurants’ locations. If it explains only 57% of restaurant locations, then my question is not completely answered.

So does a higher urban population mean more people eating pizza? Kind of.

What is a more conclusive reason for Domino’s to open a store in a new town, or add another outlet to a city with dozens of restaurants? GDP? Sheer population? I’m not sure yet, but I’ll keep this page updated and try and find a more conclusive reason for why another Domino’s outlet should or should not open in my city.