My experience at a venture funded computer vision startup

I recently interned at Dragonfruit AI (https://dragonfruit.ai/), a Video AI startup currently focussed on physical security. 

Every heist movie has a security guard looking at a wall of videos in a dimly lit backroom. Our heist protagonists pick a time when the guard is out on a restroom break. The next morning, the museum staff notices a priceless vase missing and all hell breaks loose. The security team starts poring over hours and hours of footage from the previous day, from dozens of different cameras, frantically looking for something that might lead them to the criminals but it’s too late. 

Imagine you could use computer vision to automatically and instantly analyze the dozens of videos pouring into the feed and identify all the people in it. Then you had an algorithmic layer on top of the machine learning driven identification to correlate these people across different cameras and track their path. You could instantly be alerted when a person not identified as museum security was lingering on the premises and alert the authorities. This is what Dragonfruit can do.

Say you’re a traffic authority looking at an intersection and want to identify all the blue cars that took an illegal turn over the past day? You can use Dragonfruit to find them in a second. Say you’re a detective and need to investigate an accident and see if a person in a red hoodie was hit by a green car? Use Dragonfruit to find out in a second.

I worked on the platform team at Dragonfruit, the team responsible for the infrastructure that goes behind ingesting terabytes of data from thousands of cameras, feeding it to the machine learning algorithms, storing the results and organizing it to make it easy for other microservices and the frontend to access.

My project was to work on the local version of Dragonfruit’s cloud infrastructure with the goal of deploying our software onto a private network. This is important because, for compliance reasons, it is not always possible for our customers to upload security footage to the cloud. Every week, I was getting my hands dirty building on layers upon layers of architecture, from setting up Kubernetes services and ensuring they communicated with one another correctly, to connecting them to our databases, making sure they talked to the right messaging queues and indexed the results correctly in the internal search engine. 

Thinking about the on-premise infrastructure for a SaaS service is a serious technical puzzle and figuring it out bit by bit taught me how to use a whole host of technologies as well as the ins and outs of setting up these pieces within a larger system in a short period of time. I learned just how much challenging problems can accelerate your pace of learning during this internship. Watching the pieces come together over the course of 4 months was like watching a 1000-piece jigsaw puzzle come to completion. First, the mountains come into picture. Then, you see a river and some houses. Finally, you have the landscape. It was very rewarding and personally fulfilling.

But this isn’t a coincidence. To have this special mix of motivation to work every morning, willingness to drink from a firehose of information and personal fulfillment during a persistent technical challenge, I think the work environment needs to provide you with a few features. First, you need to have a sense of ownership over your work. Second, you have to know that your work matters and substantially moves a needle for the “whole”. Third, you need to have support to turn to when you are stuck or it is too easy to lose steam and cruise.

In my experience, most good big companies provide you with the first and third but not the second. This makes sense because in big companies, by definition, intern projects are not as wide in scope since there is X amount of work but 1000+ employees to divide that among. Most good startups that hire interns provide you with one and two but not three. This also makes sense because they are moving too fast to stop and wait for the intern to catch up at that stage.

Dragonfruit has a unique culture of hiring more interns than other startups at that stage and through a process of trial and error (and more iterations since there are more interns), a process for quickly making them effective, somewhat circumventing the “catch up” problem. This allows Dragonfruit to provide all 3, making it the best case work experience for someone curious about working at a startup.

Dragonfruit also gave me an insider’s view on how effective startups work. I learned about the high pace, the changing prioritization of tasks, the intensity of work and the value of quick prototyping and validating your market hypotheses based on customer response. I believe this is a great opportunity to work on a challenging technical project with a world class team while learning how a well-funded startup operates and would highly recommend anyone interested to apply. 

Quick Recap: Where should businesses open next?

I have spent the past many months working on recommending to businesses which cities they should open outlets in next. And I’ve published a good bit of my findings on this blog. Here it is, all in one place:

  1. Where should Bajaj Finance open next?
  2. Where should Capital First open next?
  3. Where should Uber open next?
  4. Where should Ola Cabs open next?

The blog posts behind the same can be found here:

  1. Bajaj Finance
  2. Capital First
  3. Uber
  4. Ola Cabs

Here’s the code behind my model.

Aside: If you’re wondering why I haven’t uploaded in a while, it’s because I’ve been pretty busy studying for my twelfth grade board exams (exactly as stressful as it sounds). I’m going to be back to programming and conducting more research on businesses and their franchise locations as soon as my exams are done. I can’t wait to get back. Thanks for reading!

Updated: How much should you bid for Phase 3 of the FM Auction?

FM Companies: Here’s the updated cheat sheet for bidding at phase 3 of the FM auctions.

This updated model has tighter ranges and is, in my opinion, more accurate. I used Facebook’s ad reach potential for each city as a predictor of its license fee to build a linear regression model. Predictions here are based on that model. If you’re interested, here‘s the code for that model.

This Facebook fueled model beats the franchise based model I built a week ago for two reasons. First, Facebook’s ad reach potential is a better proxy for a city’s advertising potential than franchise data. Advertising potential is directly related to how much companies will spend on advertising their products on radio, which, in turn, is directly related to the price at which an FM station gets sold.

Second, the Facebook ad potential helped my predictions get more granular. Two cities, no matter how similar they might be, rarely get sold at the same price. Using franchises as a predictor didn’t provide my data with this price uniqueness. I only ended up with many buckets of similarly priced cities. If a city had 1 Cafe Coffee Day and 1 Domino’s pizza store, my model predicted it to sell at the exact same price as every other city with 1 Cafe Coffee Day and 1 Domino’s pizza store. That’s still a good approximation, but my facebook fueled model allows me to go beyond that approximation.

For a 60% chance of winning the auction for a city, bid the amount in the second column. For an 80% chance, bid the amount in the third column. For an almost-certain 95% chance, bid the amount in the fourth column.

A third of the cities up for auction in the last round of Phase 3 of the auctions went unsold. The cities highlighted in the table below are my predictions for which cities are likely to go unsold in this round.

Ask yourself how badly you want the frequency of a particular city. Refer to the table to find the value that matches your priority for that city. Bid that amount. (All figures in lakhs of rupees.)

City 60% chance 80% chance 95% chance Reserve Price
Achalpur 143 249 416 171
Agartala 279 383 546 16
Aizwal 308 411 573 12
Akola 213 318 483 30
Alappuzha 351 454 615 702
Amravati 259 363 527 351
Asansol 331 433 596 194
Barshi 152 258 424 171
Belgaum 323 426 588 702
Bellary 213 318 483 702

Click here to view and download the table.

If you’re very eager on buying the frequency for Achalpur, you’re best off bidding the amount in the 95% chance column. Bidding at 416 lakhs gives you an almost certain chance of clearing the round with the frequency in hand.

Suppose you’re not as confident about the frequency for Agartala; you’re not as desperate to go out and get it. You decide that you want to bid an amount that will give you a 60% chance of winning the auction for Agartala’s FM Station. Bidding at 279 lakh is your best bet.

A quick note about reserve prices: the higher it is compared to the 60% chance bid, the lower the probability of the frequency selling. For Achalpur, the reserve price (171 lakh) is above the 60% bid (143 lakh). For Agartala, however, there’s some distance between the reserve price (16 lakh) and the 60% bid (279 lakh). This means that the FM station for Agartala will sell like hot cakes but that for Achalpur won’t. Cities highlighted in the table are likely go unsold.

I hope this table was valuable to you. Good luck at the auctions!

How much should you bid for Phase 3 of the FM Auction?

Dear FM companies, here is your cheat sheet for the upcoming round of the phase 3 FM auctions:

For a 60% chance of winning the auction for a city, bid the amount in the second column. For an 80% chance, bid the amount in the third column. For an almost-certain 95% chance, bid the amount in the fourth column. (I’ll be talking about the statistical models and data collection that went into this in an upcoming post.)

A third of the cities up for auction in the last round of Phase 3 of the auctions went unsold. The cities highlighted in the table below are my predictions for which cities are likely to go unsold in this round.

Ask yourself how badly you want the frequency of a particular city. Refer to the table to find the value that matches your priority for that city. Bid that amount. (All figures in lakhs of rupees.)

City 60% chance 80% chance 95% chance Reserve Price
Achalpur 237 420 710 171
Agartala 416 599 887 16
Aizwal 342 524 812 12
Akola 375 458 590 30
Alappuzha 272 356 490 702
Amravati 434 517 648 351
Asansol 912 1074 1329 194
Barshi 342 524 812 171
Belgaum 421 504 635 702
Bellary 284 369 504 702

Click here to view and download the full table.

Take Achalpur for example. Maybe you’re very keen on buying the FM station for Achalpur because of say, your business connections there. You’re best off bidding 710 lakhs for a 95% chance of bagging the frequency for Achalpur.

Maybe, unlike Achalpur, you’re not familiar with the business atmosphere in Agartala. Quite naturally, you decide that you want a lower, say 60% shot at winning the frequency for Agartala. In this case, you should look toward bidding at 416 lakh.

So that’s the way you want to bid for every frequency up for auction. But maybe just knowing what price to bid isn’t enough for you. You want to know if you’re getting a bang for your buck. The last column, the reserve price, gives an indication of just that. It’s the price at which an auction kicks off – a ‘base price’ for every city up for auction.

Some cities are overvalued and others are undervalued. For Agartala, the reserve price is far lower than the 60% bid; if you don’t buy it, someone else likely will. It’s reasonably valued. Now take a look at Alappuzha. It’s reserve price is quite high; it even tops the 60% bid. It’s an overvalued frequency and you would not want to buy it unless you’re very interested in Alappuzha. These ‘overvalued frequencies’ are highlighted in the table. My model says that these cities are punching above their weight: their reserve prices are way too high.

I hope this table was of value to you. Good luck at the auctions!

Will Alappuzha ever get an FM radio station?

Alappuzha, a 2 million-people city in Kerala, has a problem. It lacks its own FM radio station. Why’s that a problem? Because this isn’t some small town in the middle of nowhere. It’s a city with a population that demands an FM channel and has more than enough potential to deserve one. Before I talk about why Alappuzha might not get an FM station, here’s some history that will make clear why it matters.

Alappuzha_Medical_College

Alappuzha Medical College

There’s always been a lot of demand for an FM channel from the locals. All they have right now is relayed radio from New Delhi and Trivandrum, which they don’t want for obvious reasons. They want their own unique voice – their own FM station. Apart from that, there’s a community called the Kuttanad farmers who are keen on receiving a frequency that will detail conversations with agricultural experts, talk about new projects, subsidies and even allow farmers to air their own content – all of which will undoubtedly help them.

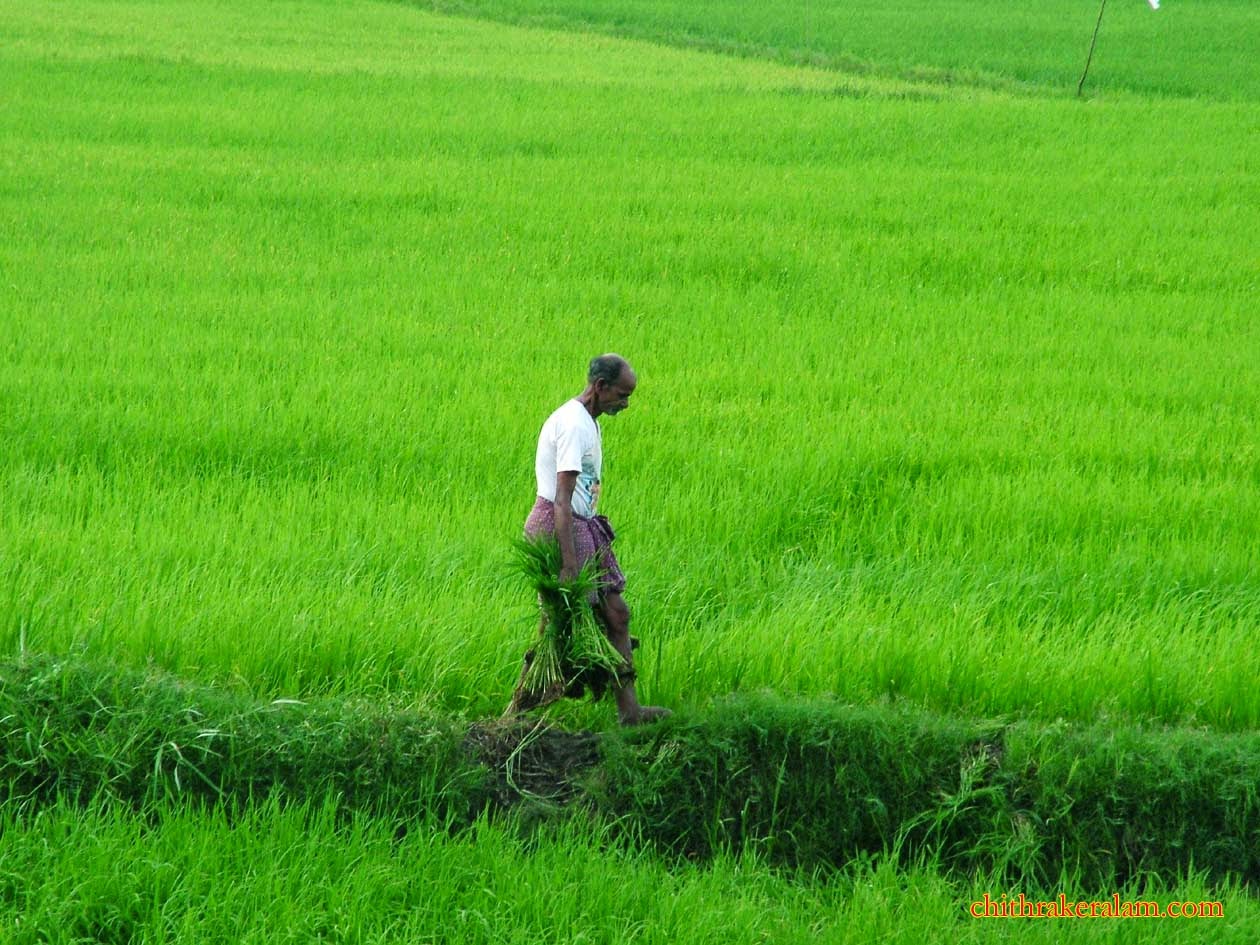
a farmer in paddy field

Farmer in a paddy field

nehr

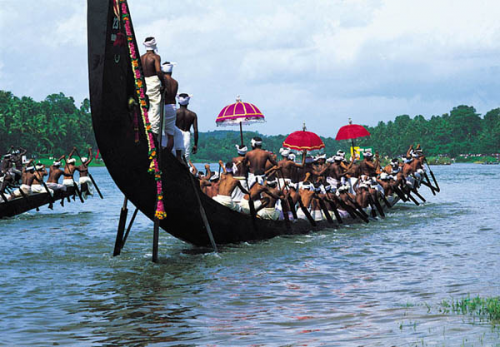
Boat Race in Alappuzha


So if there’s demand, why haven’t the people and the State government of Kerala appealed to the Center in the past? Thing is, they have. The State government tried to do just that in 2006, 2009 and 2010; all three proposals were rejected. The Center said that they’ve already allocated all available frequencies to private companies who aren’t using those frequencies to broadcast anything. Basically, no slots and no FM. So far, save for the one relaying station AIR set up all the way back in 1971, the FM scene in the city has been dry.

Still, maybe it’s all in the past and Alappuzha will finally get an FM station in the upcoming round of auctions. After all, Phase 3 is supposed to spread the reach of radio to Category C and D small towns. But will they really get an FM station? My model predicts that the frequency for Alappuzha has only a 17% chance of getting auctioned. It seems a little pricey at a minimum price of 4.23 crores, given that cities like Guwahati, Agra, Surat and Allahabad sold for less.

If it’s any consolation, frequencies for Eroda, Salem, Vellore, Malegaon and Latur are also likely to go unsold. Citizens of Alappuzha: I’m sorry but your wait for an FM station just got longer.

Every frequency has a price at which companies will snap it up. This one is just a bit too high.

Predictions for FM Auction Phase 3

FM auctions for over 200 cities are starting tomorrow. Since 45 of 135 auctions failed the last time round, I tried to take a crack at finding which auctions will fail this time. This blog post is about my predictions for the second round of Phase 3 of this auction. Let’s see what happens when the actual auction data rolls in.

The cities least likely to get auctioned according to my model: Alappuzha, Eroda, Salem, Vellore, Malegaon, Latur, Bijapur, Bellary, Barddhaman, Baharampur, English Bazar, Abohar, Thanjavur, Dindigul, Kanhagad, Karaikkudi, Karur, Neyveli, Pudukkottai, Rajapalayam, Tiruvannamalai, Bharuch, Junagadh, Mehsana and Yavatmal. These cities have a lower ‘ratio’ because the model deems the reserve prices of these cities to be too exorbitant.

The cities most likely to get auctioned according to my model: Saharanpur, Muzaffarnagar, Ujjain, Ambala, Tinsukia, Nellore, Dhanbad, Siwan and Ludhiana. These cities have a higher ‘ratio’ because their reserve price is quite reasonable compared to the prices they’re expected to sell at.

I have built this model based on the ‘Category’, Domino’s pizza outlets, Cafe Coffee Day stores and Hero MotoCorp dealerships in each of these cities – a proxy for the paying capacity of consumers in that city.

The recommended bid is the value (in lakhs of rupees) that a company should want to start bidding at, and Max Bid is where the company should stop bidding. The last column indicates the chance of success of the auction.

Take Abohar for example. The reserve price is a good way away from the Maximum bid for its frequency – an indicator that the auction will likely succeed. Now, do the same for Alappuzha. The Reserve price is at the heels of the Maximum bid price. This is an indicator that the auction will likely fail.

These are my predictions for the second round of the Phase 3 FM auctions:

City Reco Bid (in lakhs) Max Bid (in lakhs) Reserve Price (in lakhs) Probability of auction success
Abohar 12 677 135 0.81
Achalpur 50 835 124 0.91
Adilabad 21 748 110 0.88
Adoni 50 835 110 0.92
Alappuzha (Alleppey) 141 480 423 0.17
Alipurduar 50 835 110 0.92
Alwal 50 835 110 0.92
Alwar 125 792 214 0.87
Ambala 292 992 123 1.24
Amravati 292 577 310 0.94
Anantpur 192 921 110 1.11
Arrah 12 677 39 0.96
Azamgarh 192 921 58 1.18
Baharampur 21 748 214 0.74
Bahraich 21 748 58 0.95
Baleshwar 21 748 58 0.95
Ballia 21 748 58 0.95
Balurghat 21 748 110 0.88
Bands 21 748 58 0.95
Bangaon 50 835 110 0.92
Bankura 21 748 110 0.88
Barddhaman 12 677 214 0.70
Baripada 21 748 58 0.95
Barshi 21 748 124 0.86
Basti 21 748 58 0.95
Beawar 21 748 110 0.88
Begusarai 12 677 39 0.96
Belgaum 279 565 268 1.04
Bellary 154 452 268 0.62
Bettiah 21 748 39 0.98
Bhadurgarh 12 677 123 0.83
Bhagalpur 154 452 105 1.16
Bharatpur 192 921 110 1.11
Bharuch 12 677 124 0.83
Bhatinda 234 926 135 1.14
Bhavnagar 268 553 310 0.85
Bheemavaram 21 748 110 0.88
Bhilwara 125 792 214 0.87
Bhiwani 12 677 123 0.83
Bidar 21 748 99 0.89
Bihar Shareef 21 748 39 0.98
Bijapur 12 677 268 0.61
Bokaro Steel City 12 677 39 0.96
Botad 39 760 124 0.88
Brahmapur 125 792 130 0.99
Budaun 21 748 58 0.95
Burhanapur 21 748 66 0.94
Chapra 21 748 39 0.98
Chhattarpur 21 748 66 0.94
Chhindwara 12 677 66 0.92
Chikmagalur 24 727 99 0.89
Chirala 21 748 110 0.88
Chitradurga 21 748 99 0.89
Chittoor 41 745 110 0.90
Churu 21 748 110 0.88
Coonoor 39 760 150 0.85
Cuddapah 12 677 110 0.85
Daman 21 684 124 0.84
Damoh 21 748 66 0.94
Darbhanga 12 677 39 0.96
Darjiling 41 702 110 0.90
Dehradun 446 741 448 0.99
Deoghar 21 748 39 0.98
Deoria 21 748 58 0.95
Devengeri 268 553 268 1.00
Dhanbad 690 1181 580 1.22
Dharamavaram 50 835 110 0.92
Dibrugarh 44 731 25 1.03
Dimapur 21 748 25 1.00
Dingdigul 21 748 150 0.82
Dohad 21 748 124 0.86
Durg-Bhillainagar 12 677 42 0.95
Eluru 21 748 110 0.88
English Bazar (Maldah) 21 748 214 0.74
Erode 268 553 423 0.46
Etah 21 748 58 0.95
Etawah 21 748 58 0.95
Faizabad/Ayodhya 21 748 58 0.95
Farrukhabad cum Fatehgarh 21 748 58 0.95
Fatehpur 21 748 58 0.95
Gadag Betigeri 50 835 99 0.94
Ganganagar 12 677 110 0.85
Gaya 154 452 105 1.16
Ghazipur 21 748 58 0.95
Giridih 21 748 39 0.98
Godhra 21 748 124 0.86
Gonda 21 748 58 0.95
Gondiya 21 748 124 0.86
Guna 21 748 66 0.94
Guntakal 50 835 110 0.92
Haldwani-cum Kathgodam 44 731 150 0.85
Hanumangarh 50 835 110 0.92
Hardoi 192 921 58 1.18
Hardwar 79 766 150 0.90
Hassan 21 748 99 0.89
Hazaribag 12 677 39 0.96
Hindupur 50 835 110 0.92
Hoshiarpur 68 756 135 0.90
Hospet 21 748 99 0.89
Hubli-Dharwad 314 601 268 1.16
Imphal 21 748 67 0.94
Itarsi 50 835 66 0.98
Jagdalpur 21 748 42 0.97
Jamnagar 268 553 310 0.85
Jaunpur 192 921 58 1.18
Jetpur Navagadh 50 835 124 0.91
Jhunjhunun 21 748 110 0.88
Jind 21 748 123 0.86
Jorhat 12 677 25 0.98
Junagadh 12 677 124 0.83
Kaithai 12 677 123 0.83
Kakinada 268 553 214 1.19
Kanhangad (Kasargod) 21 748 150 0.82
Karaikkudi 21 748 150 0.82
Karimnagar 192 921 110 1.11
Karur 21 748 150 0.82
Kavarati 50 835 5 1.06
Khammam 21 748 110 0.88
Khandwa 12 677 66 0.92
Kharagpur 44 731 110 0.90
Khargone 21 748 66 0.94
Kohima 50 835 25 1.03
Kolar 59 763 99 0.94
Korba 125 792 42 1.12
Kothagudem 21 748 110 0.88
Krishnanagar 21 748 110 0.88
Kurnool 267 560 214 1.18
Lakhimpur 192 921 58 1.18
Lalitpur 21 748 58 0.95
Latur 12 677 310 0.55
Ludhiana 1091 1581 989 1.21
Machillpatnam 50 835 110 0.92
Madanapalle 50 835 110 0.92
Mahbubnagar 24 727 110 0.88
Mahesana 12 677 124 0.83
Mainpuri 21 748 58 0.95
Malegaon 141 480 310 0.50
Mancherial 21 748 110 0.88
Mandsaur 21 748 66 0.94
Mathura 175 867 58 1.17
Maunath Bhajan (Distt. Mau) 192 921 58 1.18
Mirzapur cum Vindhyachal 21 748 58 0.95
Moga 68 756 135 0.90
Moradabad 685 1235 576 1.20
Motihari 21 748 39 0.98
Munger 21 748 39 0.98
Murwara (Katni) 21 748 66 0.94
Muzaffarnagar 267 560 130 1.47
Nagaon (Nowgang) 21 748 25 1.00
Nagarcoil/Kanyakumari 192 921 150 1.06
Nalgonda 41 745 110 0.90
Nandyal 21 748 110 0.88
Neemuch 12 677 66 0.92
Nellore 279 565 214 1.23
Neyveli 21 748 150 0.82
Nizamabad 192 921 214 0.97
Ongole 21 748 110 0.88
Orai 21 748 58 0.95
Palakkad 125 792 150 0.96
Palanpur 21 748 124 0.86
Pali 21 748 110 0.88
Panipat 151 842 123 1.04
Patan 21 748 124 0.86
Pathankot 116 806 135 0.97
Porbandar 21 748 124 0.86
Portblair 21 748 25 1.00
Proddatur 21 748 110 0.88
Pudukkottai 21 748 150 0.82
Puri 44 731 58 0.98
Purnia 21 748 105 0.88
Puruliya 21 748 110 0.88
Rae Barelli 125 792 58 1.10
Raichur 21 748 99 0.89
Rajapalayam 21 748 150 0.82
Ramagundan 50 835 110 0.92
Raoganj 21 748 110 0.88
Ratlam 12 677 66 0.92
Rewa 12 677 66 0.92
Rewari 44 731 123 0.88
Rohtak 44 731 123 0.88
Sagar 154 452 140 1.05
Saharanpur 292 577 130 1.57
Saharsa 21 748 39 0.98
Salem 267 560 423 0.47
Sambalpur 12 677 58 0.93
Sasaram 21 748 39 0.98
Satna 12 677 66 0.92
Sawai Madhopur 21 748 110 0.88
Shahjahanpur 154 452 130 1.08
Shimoga 192 921 268 0.90
Shivpuri 21 748 66 0.94
Sikar 192 921 110 1.11
Silchar 12 677 25 0.98
Singrauli 50 835 66 0.98
Sirsa 12 677 123 0.83
Sitapur 192 921 58 1.18
Siwan 192 921 39 1.21
Sultanpur 192 921 58 1.18
Surendranagar Dudhrej 50 835 124 0.91
Thanesar 39 760 123 0.88
Thanjavar 24 727 150 0.82
Tinsukia 192 921 25 1.23
Tiruvannamlai 21 748 150 0.82
Tonk 21 748 110 0.88
Tumkur 199 893 99 1.14
Udupi 50 835 99 0.94
Ujjain 267 560 140 1.43
Vaniyambadi 50 835 150 0.87
Vellore 279 565 423 0.50
Veraval 21 748 124 0.86
Vidisha 21 748 66 0.94
Vizianagaram 12 677 110 0.85
Wardha 21 748 124 0.86
Yavatmal 12 677 124 0.83

A probability greater than 1 in the last column indicates a 100% chance of the frequency getting sold.

Some data about the reserve prices wasn’t available, so what follows is an FM prediction for certain cities in case they do go up for auction:

City Reco Bid (in lakhs) Max Bid (in lakhs)
Amritsar 1009 1503
Asansol 607 1109
Bhopal 1196 1689
Chennai 10842 12121
Coimbatore 1295 1802
Gangtok 41 702
Gulbarga 154 452
Gwalior 303 588
Indore 1359 1867
Jabalpur 760 1253
Jalandhar 705 996
Kannur 188 504
Kolkatta 9868 11389
Mangalor 539 827
Mysore 622 911
Pannaji 44 731
Pondicherry 410 699
Raipur 611 901
Rajamumdry 267 560
Rajgarh 50 835
Ranchi 637 956
Shimla 41 702
Siliguri 373 661
Tiruchy 279 565
Tirunelveli 154 452
Tirupati 154 452
Tiruvananthapuram 242 545
Trissur 448 745
Tuticorin 141 480
Vadodara 1253 1759
Vijayawada 784 1276
Visakhapatnam 760 1253
Wadhwan (Surendernagar) 21 748
Warangal 267 560

I’ll talk about how I built the models that went into this prediction, the data collection behind the variables I used, the conclusions I drew from this model and how this model scales up to the actual auction in the next few blog posts. I’ll also talk about how I constructed the ratio that judges whether a frequency is fairly priced or not. Stay tuned.

Predicting FM Auctions (Phase 3) – Part 1

The second batch of Phase 3 FM Auctions in India is to take place tomorrow. This means that radio spectrums for over 200 cities are going to be up for auction. Now, what’s a spectrum? And how can a radio company broadcast its content in that spectrum? A spectrum, the same as a frequency, is a slice of a city’s bandwidth. You can think of a frequency as a proportion of the city’s capacity to broadcast.

Buying one of these spectrums allows a radio company to air content in that city. For example, if a city has 7 frequencies up for auction and we go ahead and buy one, we earn the right to broadcast in that city along with 6 other companies – provided that every frequency sells.

Tomorrow, all these frequencies are going to be up for auction and bid on by big players in the Indian radio market such as Entertainment Network India and HT Media, who shell out crores of rupees for frequencies. And why would a company pay this much for rights to broadcast in a city? Because advertisers pay them huge money for those 30-second segments that feature in between songs on the radio.

My only real exposure to FM radio is having it play in the background of cab rides (my family and I prefer to talk), but the idea of being able to maybe predict something – to essentially ‘see’ the future, got me quite excited. That’s why I decided to try and predict the prices these frequencies would sell at before the auction happened. This is what I’ve been working on over the past few weeks. I found the results for the first batch of Phase 3 auctions here and built a linear regression model trained on this data. Then, I went on to use this model to predict the prices that these 200 plus frequencies would sell at.

radio-mirchi-hindiHT media

The next few blog posts are going to be about this process of model building, finding out how much these private companies should bid and whether certain frequencies are going to get sold at all or not. These new blog posts might also be about me hitting way off the mark and trying to learn why my predictions were wrong. I’ll find out soon enough. I’ll head back to recommender systems once I successfully build and test this model. And once I see how it compares to the actual prices these frequencies get sold at.

Building a model that predicts where Domino’s pizza should open

Picking up where I left off on my last blog post, I decided to work on Domino’s Pizza and see what I’d find. I got to work and applied user-based collaborative filtering to my franchise data of store locations for Domino’s Pizza, Eicher Motors, Hero MotoCorp, Cafe Coffee Day, Inox Movies and V-Mart from back in 2015. I found a package called recommenderlab in R and (I’ll spare you the technical details) built a model to recommend locations for franchise openings. I was prepared to run my program right away, but first I had to make sure this model could predict franchise locations at least somewhat accurately. I had to make sure my program worked.

To do this, I took store location data for Domino’s Pizza that I’d collected back in 2015 and ran my model. It told me that Bharatpur, Chittorgarh and Palakkad were the top 3 towns Domino’s should open in. I went onto the Domino’s locations web page to see if I’d struck gold. And I had. One year later, Domino’s now has stores open in Chittorgarh and Palakkad.

dominos logo

This really excites me because if this holds true for other franchises, then maybe I’ll know where franchises are going to open before they do. And maybe, to some degree,  I’ll be able to recommend cities for companies to open in.

Recommending future franchise locations

I grew up in Margao, Goa – a place known for beaches, greenery and a happy-go-lucky lifestyle. As kids, my friends and I loved junk food. Every summer we’d talk about how a friend of mine went to an aunt’s house in Mumbai or some other big city and how he’d eaten at Domino’s pizza or KFC while he was there. We’d always ask the same questions: “How was the food?” and “Is it better than pizzas here?”, and we’d always get the same answer: wide eyes and a hum of approval. More than that even, I think we liked the idea of being part of a big city. Being big time. Eating pizza at Domino’s was definitely worth bragging rights as a middle schooler in Goa.

Margao was a sleepy town. There were no Domino’s or McDonald’s or Inox movie halls. On some weekends, my friends and I would take an hour long bus to Panaji just to get to eat at Domino’s pizza and watch a movie at Inox. We would plan this trip for weeks and spend a lot of that time wishing that Domino’s would someday open in Margao. This got me thinking about ways by which I’d know when and where a new franchise would open. I needed to know when Domino’s was coming to town.

India_Goa-30

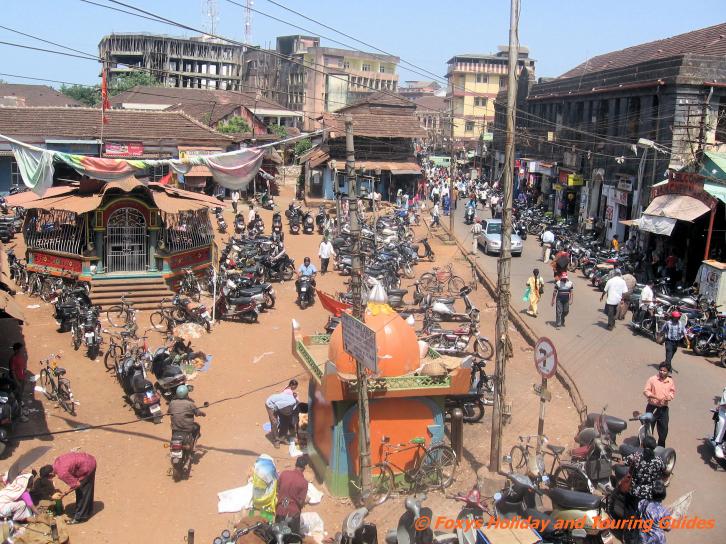
Bogmalo beach, Margao

Margao_small

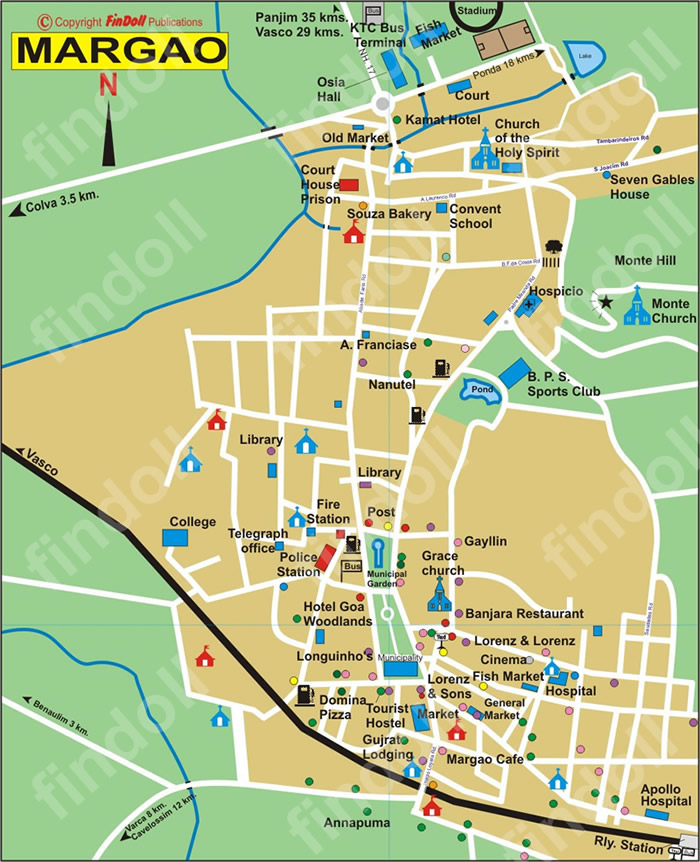
A map of Margao

Now, 5 years later, I finally have the skills to try and do this. The next few blog posts are going to be a slight bit different; I’m going to be exploring the possibility of future franchises using recommender systems and R. I found a course offered by the University of Minnesota and this link quite helpful in understanding how recommender systems work. There’s plenty of recommender algorithms out there. I studied recommender systems and found that User-based collaborative filtering would best serve my purpose of, well, predicting the future.

User-based collaborative filtering basically means this: If you like pizza and I like pizza, we have similar tastes. If the both of us also like Thai food, we’re more similar. This means that if you like Chinese food, I’ll probably like it too. The more foods we like in common, the more likely it is that we have similar tastes. User-based collaborative filtering does exactly this: it predicts what I’ll like based on what similar users (you) have liked. This system is used by Amazon, Facebook, Twitter and many other heavyweights in the tech world.

Instead of using recommender systems for ratings and ‘you may also like’ products, I decided to use it to map companies and their store locations. To recommend to companies where they should open their next store. Stay tuned for what’s to come.


Does Uber charge more in bigger cities?

You’d pay about twice as much for an Uber ride in Nashik than in Ahmedabad. I’ve always written about franchises of companies that I see around – Inox, Cafe Coffee Day, Domino’s Pizza –and companies that intrigue me, like V Mart and Equitas Microfinance. Apart from two exceptions (Hero Motocorp and V Mart), the general ‘rule’ I’ve learnt is that more GDP equals more franchises. My friends in Pune say that Ubers are more expensive than auto rickshaws, but I’ve found that they’re priced about the same in Hyderabad. This got me curious and I decided to take a look at Uber pricing in different cities.

For a company like Uber which doesn’t have franchises, I looked around for a parallel to this ‘rule’. I couldn’t get my hands on the data of the number of cars they have per city, but I found what I think is a pretty close match: the amount they charge customers. Franchise or no franchise, as long as a service isn’t a luxury good, businesses should want to reduce prices for their poorer customers right? If they didn’t, people would just switch to booking other cabs. Or taking auto rickshaws.

Uber_Logobit_Digital_black

So why isn’t this ‘more GDP equals more franchises’ rule true all the time? Well, the argument I make in the blog posts linked is that V-Mart and Hero Motocorp specifically cater to poorer rural markets. Does Uber cater to rural markets? Nope, not yet at least. There’s not one small town in Uber’s 27-city empire.

Uber’s absence in towns makes total sense. For a town to interest Uber, the people of the town would need smartphones with an active data connection to book a cab (that’s changing a little now) and there would need to be enough employable youth who own cars.

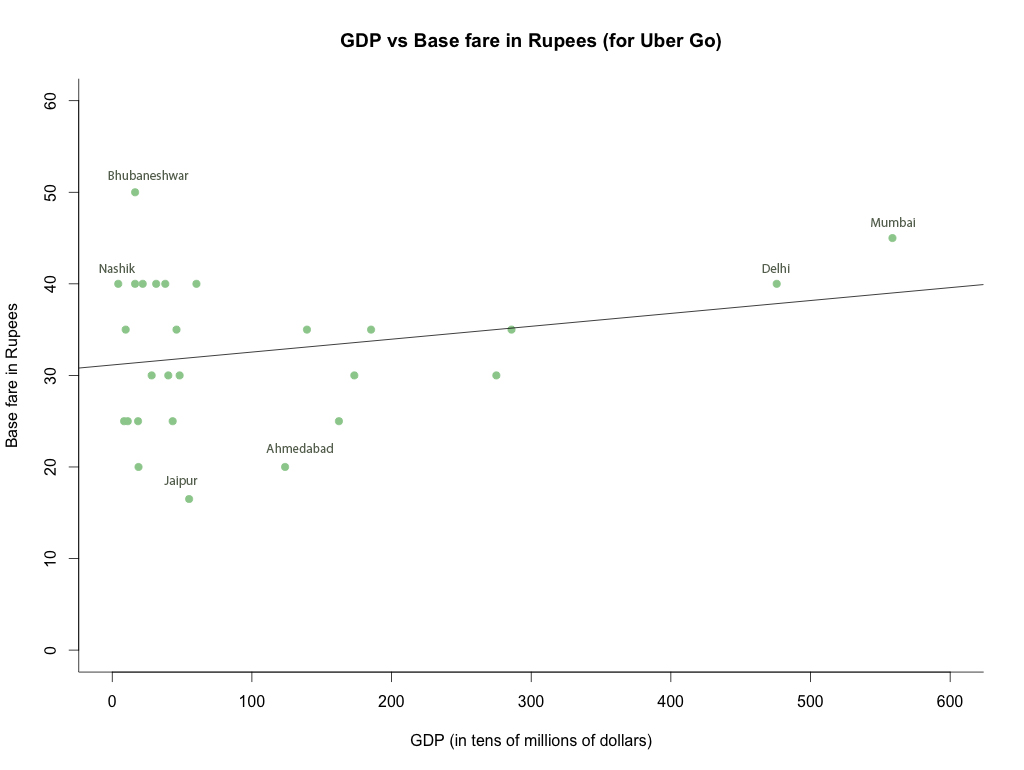
Here’s a graph I plotted that shows the lack of correlation of the base fare for Uber Go cabs on the GDP per capita in tens of millions of dollars. I found the price data on their website here. The correlation coefficient of this graph is 0.06; no correlation.

Base fare (0.06)

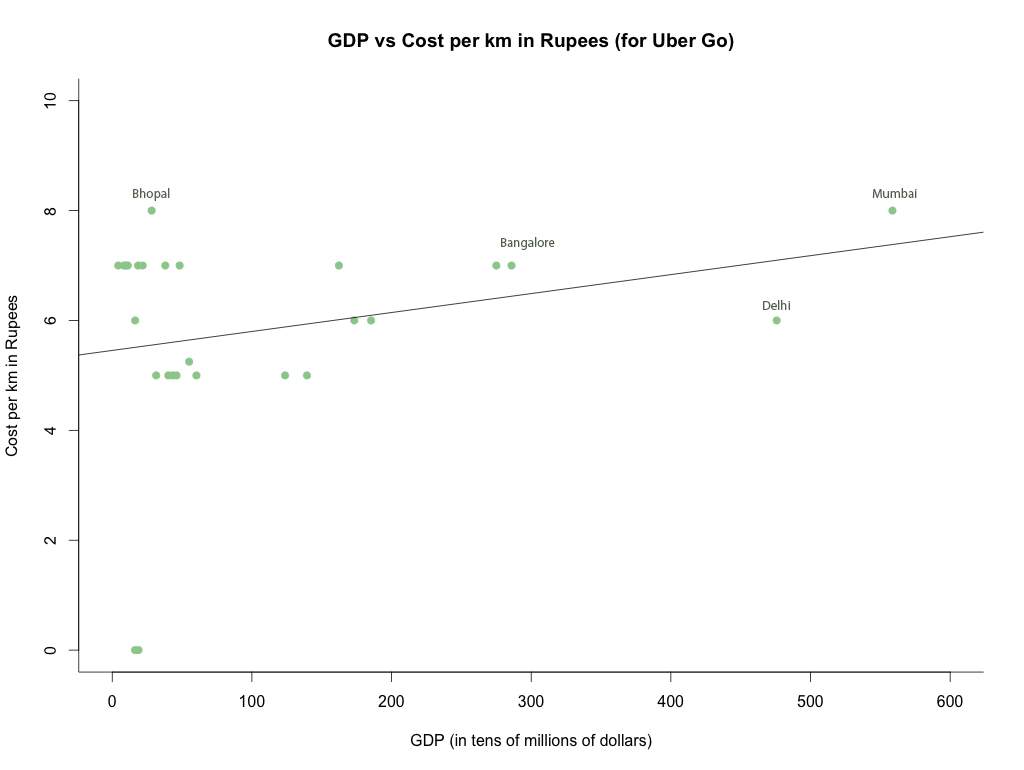
I thought that maybe base price isn’t a good parameter because some cities are larger than others, and smaller cities, on average, could charge higher base prices. That’s why I decided to take another parameter: cost per kilometer. This is the price you pay above the base price after a certain number of kilometers (generally 4 or so). I expected to find something that showed correlation – evidence that people in Nashik wouldn’t actually be paying twice as much as people in Ahmedabad – but I didn’t. I ran the correlation with cost in rupees per kilometer instead and got an R value of 0.06 again.

Cost per km in Rupees (0.06)

So Uber is a company that doesn’t seem to charge it’s richer customers more – something that’s pretty unusual. On average, maybe Uber still does charge customers from bigger cities more, but it’s not something that increases progressively with GDP. The only other times I’ve seen this pattern are with companies that cater to rural markets. I want to find out if this is exclusively an Uber thing, and to do that I’m going to need to take a look at Ola cabs, Uber’s closest competitor in India, and see what’s up. That’s what I plan to do next week.