Hero MotoCorp

Hero MotoCorp, in their annual report state that they have a 40% market share in the domestic two wheeler market. I did not recall seeing all that many Hero showrooms in Hyderabad and wanted to find out where they sell the most bikes and have maximum presence.

Hero_MotoCorp.svg


Number of Hero showrooms vs Relative GDP (updated)

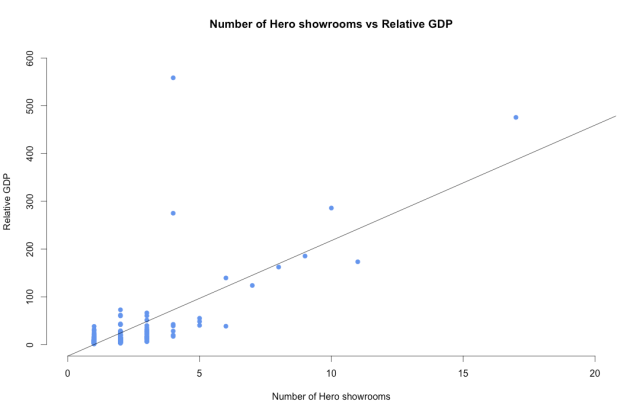
This is the graph plotting the number of Hero showrooms in Indian cities against the “Relative GDP”, or the GDP/10^8 for each city. This is the spreadsheet I made and sourced my data from.

The regression plot above has an R value of 0.52. This means that the change in the GDP of a town accounts for only 52% of the change in the number of Hero showrooms in that town.

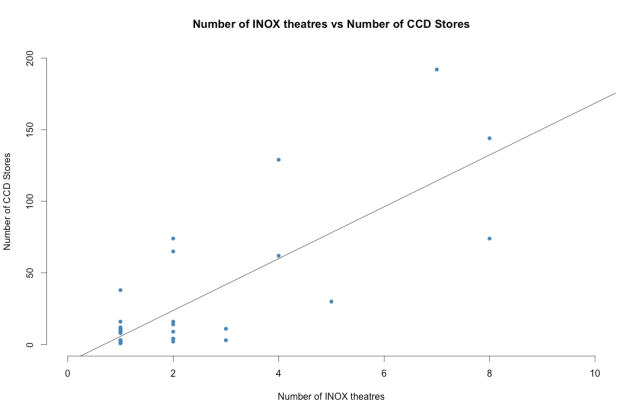
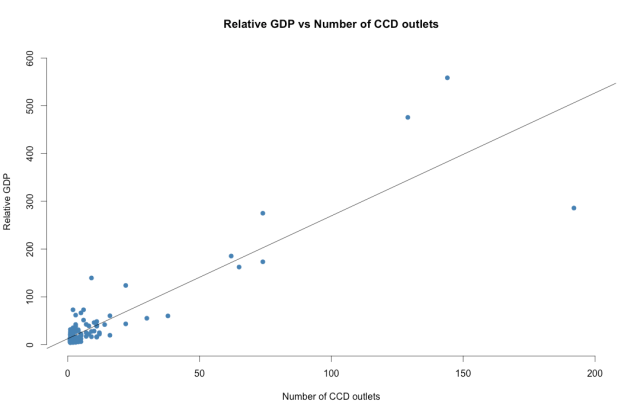
This seems a little odd to me because intuitively, shouldn’t cities with a higher GDP – typically larger cities, have a lot more franchises than smaller towns? Domino’s (0.84) and CCD (0.80) showed higher R values.

This got me searching, and eventually I found that Hero has showrooms in small towns with populations barely over a hundred thousand. I learnt that Hero has 613 locations with showrooms while Domino’s has only 212 in comparison. A smaller town can support a Hero showroom but not a Domino’s restaurant. This means that Hero has a target audience in small towns too. This could also possibly mean that the consumption of bikes in smaller towns is comparable to that of cities.

There’s also a pattern where Hero showrooms tend to increase incrementally as GDP increases while the number of Domino’s restaurants seems to grow exponentially. The city with the most number of Hero showrooms is Delhi at 17 but there’s 76 Domino’s restaurants in Delhi.

I’ll keep this page updated and try and find out more about how Hero places their showrooms.


How many INOX theatres would you find in a city with a Cafe Coffee Day?

The answer is usually close to none. That’s not very surprising because there’s 53 cities with INOX theatres across India against 230 CCD cities.


What surprises me though, is that in cities which do have both INOX theatres and CCD outlets, the scatterplot of the number of INOX theatres against CCD stores shows a higher correlation than I originally expected. The correlation coefficient, R for this regression plot is 0.62. This means that 62% of the change in number of CCD stores is explained by the change in number of INOX theatres.

INOX vs CCD (0.62)

This intrigues me because it shows that maybe the GDP of a city is correlated to the number of all sorts of franchises that the city hosts. And that number of outlets of these different franchises might be correlated too.


Correlation between Cafe Coffee Day franchise outlets and GDP of a town


Cafe Coffee Day describes itself as India’s favorite coffee shop and hangout place. CCD is a chain that has a massive presence in cities and small rural towns too.

CafeCoffeeDay

I saw one around almost every corner in Hyderabad and I started wondering how many CCD outlets there were in all. I got interested and did some research. This graph plots the relation between the number of CCD stores and the Relative GDP of a city.

Rplot

This spreadsheet contains the data plotted in the graph above.

There’s an R value of 0.80 to this graph. This means that 80% of the change in number of CCD restaurants is described by change in GDP. Here, “Relative GDP” is the total GDP of a place expressed in U.S. dollars divided by 10^8 to put everything in one scale.

This really interests me because, given the GDP of a city, I can use the regression plot to try and see how many CCD outlets the city should ideally have.