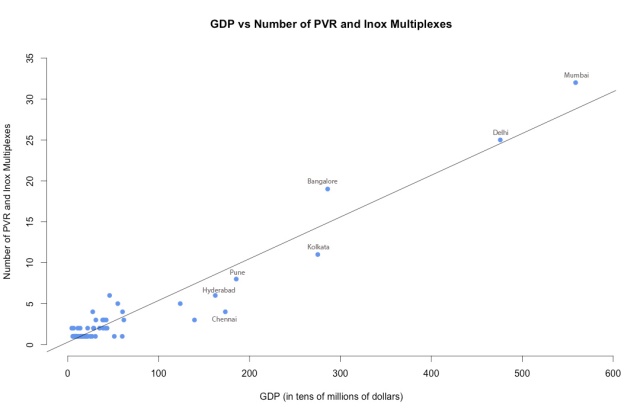
When I last looked at Hero’s data, I plotted the store count of each town against the GDP of that town and found a correlation coefficient of only 0.52. Here’s that post if you want to check it out. An R value of 0.52 is a moderate correlation, but not a conclusive one. So, I went ahead and tried looking for other variables – ones that might do a better job of explaining Hero MotoCorp showroom locations.
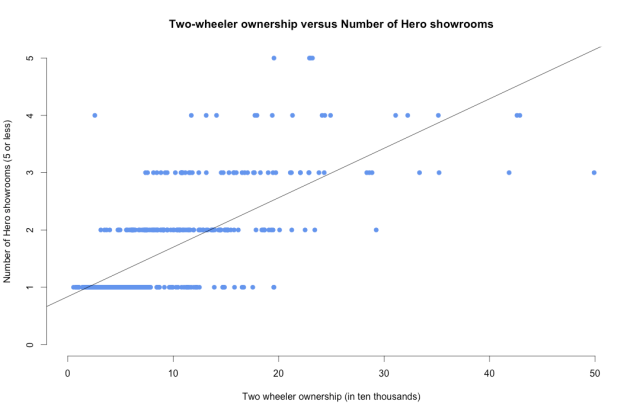
I found How India Lives – a pretty cool database with a couple thousand variables that would probably prove useful in my search for a stronger variable. I decided to plot the Two wheeler ownership – or the number of two wheelers in each district against the number of Hero showrooms in that district. I combed through my own Hero data and the How India Lives two wheeler ownership data to make this spreadsheet.
I expected a really high correlation coefficient of about 0.90. I mean, if the number of two wheelers in a district was not going to correlate with the number of Hero showrooms in that district, what would? I made a plot for the spreadsheet and found that I was dead wrong.

The correlation coefficient for two wheeler ownership against the number of Hero showrooms came to 0.53. Barely any better than the moderate correlation I found against GDP. Worse still, the plot really does not make much sense for when there’s 5 or less than 5 Hero showrooms. Here’s how it looks:
Maybe, I thought, Hero was not a big player in the motorcycle industry. I looked through their 2014-2015 annual report and found that they are the world’s largest manufacturers of two wheelers, and boast a 40.1% market share in the domestic two wheeler market. Hero was definitely a big player.
So, why does the district wise two wheeler ownership not agree with the showroom count? I don’t know yet, but I’ll keep this page updated to try and find out why.